Cycling fatalities in the United States remain a critical public health crisis, though the numbers tell a more severe story than headlines sometimes convey. While some reports cite 900 deaths annually, the most recent verified data from 2024 shows 1,392 bicyclist deaths on U.S. roads—a sharp reminder that cycling safety is deteriorating, not improving. The claim that 78% of deaths occur outside bike lanes reflects a broader, more troubling reality: our infrastructure and road design are failing cyclists in multiple environments, whether on dedicated paths or open roads.
The 2024 figures represent a 37% increase in cycling deaths over the past decade, with deaths climbing 87% since 2010. This is not a marginal problem affecting a fringe activity. Bicyclists represent only 1% of all trips in the United States yet account for over 2% of all traffic fatalities, making cycling statistically one of the most dangerous forms of transportation per mile traveled. The data demands attention because every number represents a preventable tragedy—someone who left home expecting to return.
Table of Contents
- Why Are More Cyclists Dying on U.S. Roads?
- Location Matters: Where Cyclists Face the Greatest Risk
- Demographics and Seasonal Patterns of Cycling Deaths
- Infrastructure Solutions and Their Real-World Limitations
- The Gap Between Infrastructure and Enforcement
- Vulnerable Road Users and the Broader Safety Crisis
- What the Future Holds for Cycling Safety
- Conclusion
Why Are More Cyclists Dying on U.S. Roads?
The rise in cycling fatalities stems from a convergence of factors: increased vehicle speeds in urban areas, distracted driving, inadequate infrastructure, and the sheer growth in the number of people cycling. The 87% surge since 2010 parallels the boom in recreational and commuter cycling, but also reflects a lack of corresponding investment in safe cycling infrastructure. In many American cities, cyclists share roads designed primarily for cars traveling at speeds that prove fatal in collisions. Consider a typical scenario: a cyclist riding on a street without a bike lane, a driver checking their phone, and a vehicle traveling 35 mph in a 30 mph zone.
The result is predictable and often catastrophic. Motor vehicle crashes account for the majority of cycling fatalities—in 2023, 937 of the 1,377 deaths were attributed to motor-vehicle collisions. The remaining 440 deaths occurred in other incidents, including solo crashes, falls, and collisions with fixed objects. This distinction matters because it shapes our understanding of where solutions lie. While helmet use and visibility gear help, they cannot protect a cyclist from a two-ton vehicle traveling at impact speed.

Location Matters: Where Cyclists Face the Greatest Risk
The narrative around bike lanes suggests they should be a complete solution, but the evidence is more nuanced. Data from 2019-2023 shows that 62.7% of bicyclist fatalities occurred at non-intersections—stretches of road between traffic signals where drivers may feel less constrained by formal rules. In urban areas, approximately 28.6% of fatal cyclist collisions involved cyclists using dedicated bike lanes or shared paths, indicating that presence on a bike lane alone does not guarantee safety.
This is a crucial limitation: even infrastructure designed to protect cyclists can fail if the underlying problem—dangerous driving behavior or inadequate sight lines—remains unaddressed. The concentration of deaths outside intersections suggests that many crashes occur in less-monitored areas where enforcement is spotty and drivers may travel faster. A cyclist riding through a residential neighborhood on a residential street without marked infrastructure faces different risks than one navigating an intersection with traffic lights and painted lines. Neither environment is reliably safe, but they present distinct challenges.
Demographics and Seasonal Patterns of Cycling Deaths
Cyclists who die on American roads are disproportionately male, with 88% of 2024 deaths occurring among male riders. This gender gap may reflect different cycling patterns, risk tolerance, or the types of cycling men engage in (e.g., higher speeds, more traffic-heavy routes), but the exact causes remain unclear. What is clear is that cycling safety cannot be addressed with one-size-fits-all interventions.
Seasonality is another critical pattern. Deaths peak from June through October, with August recording the highest monthly toll at 116 deaths in 2024. This summer surge aligns with increased cycling activity and longer daylight hours, but it also reflects conditions that make cycling more dangerous: heat-stressed drivers, vacation traffic, and riders who may be less experienced or familiar with their routes. Winter months see fewer deaths partly because fewer people cycle when temperatures drop, a grim natural selection effect.
Infrastructure Solutions and Their Real-World Limitations
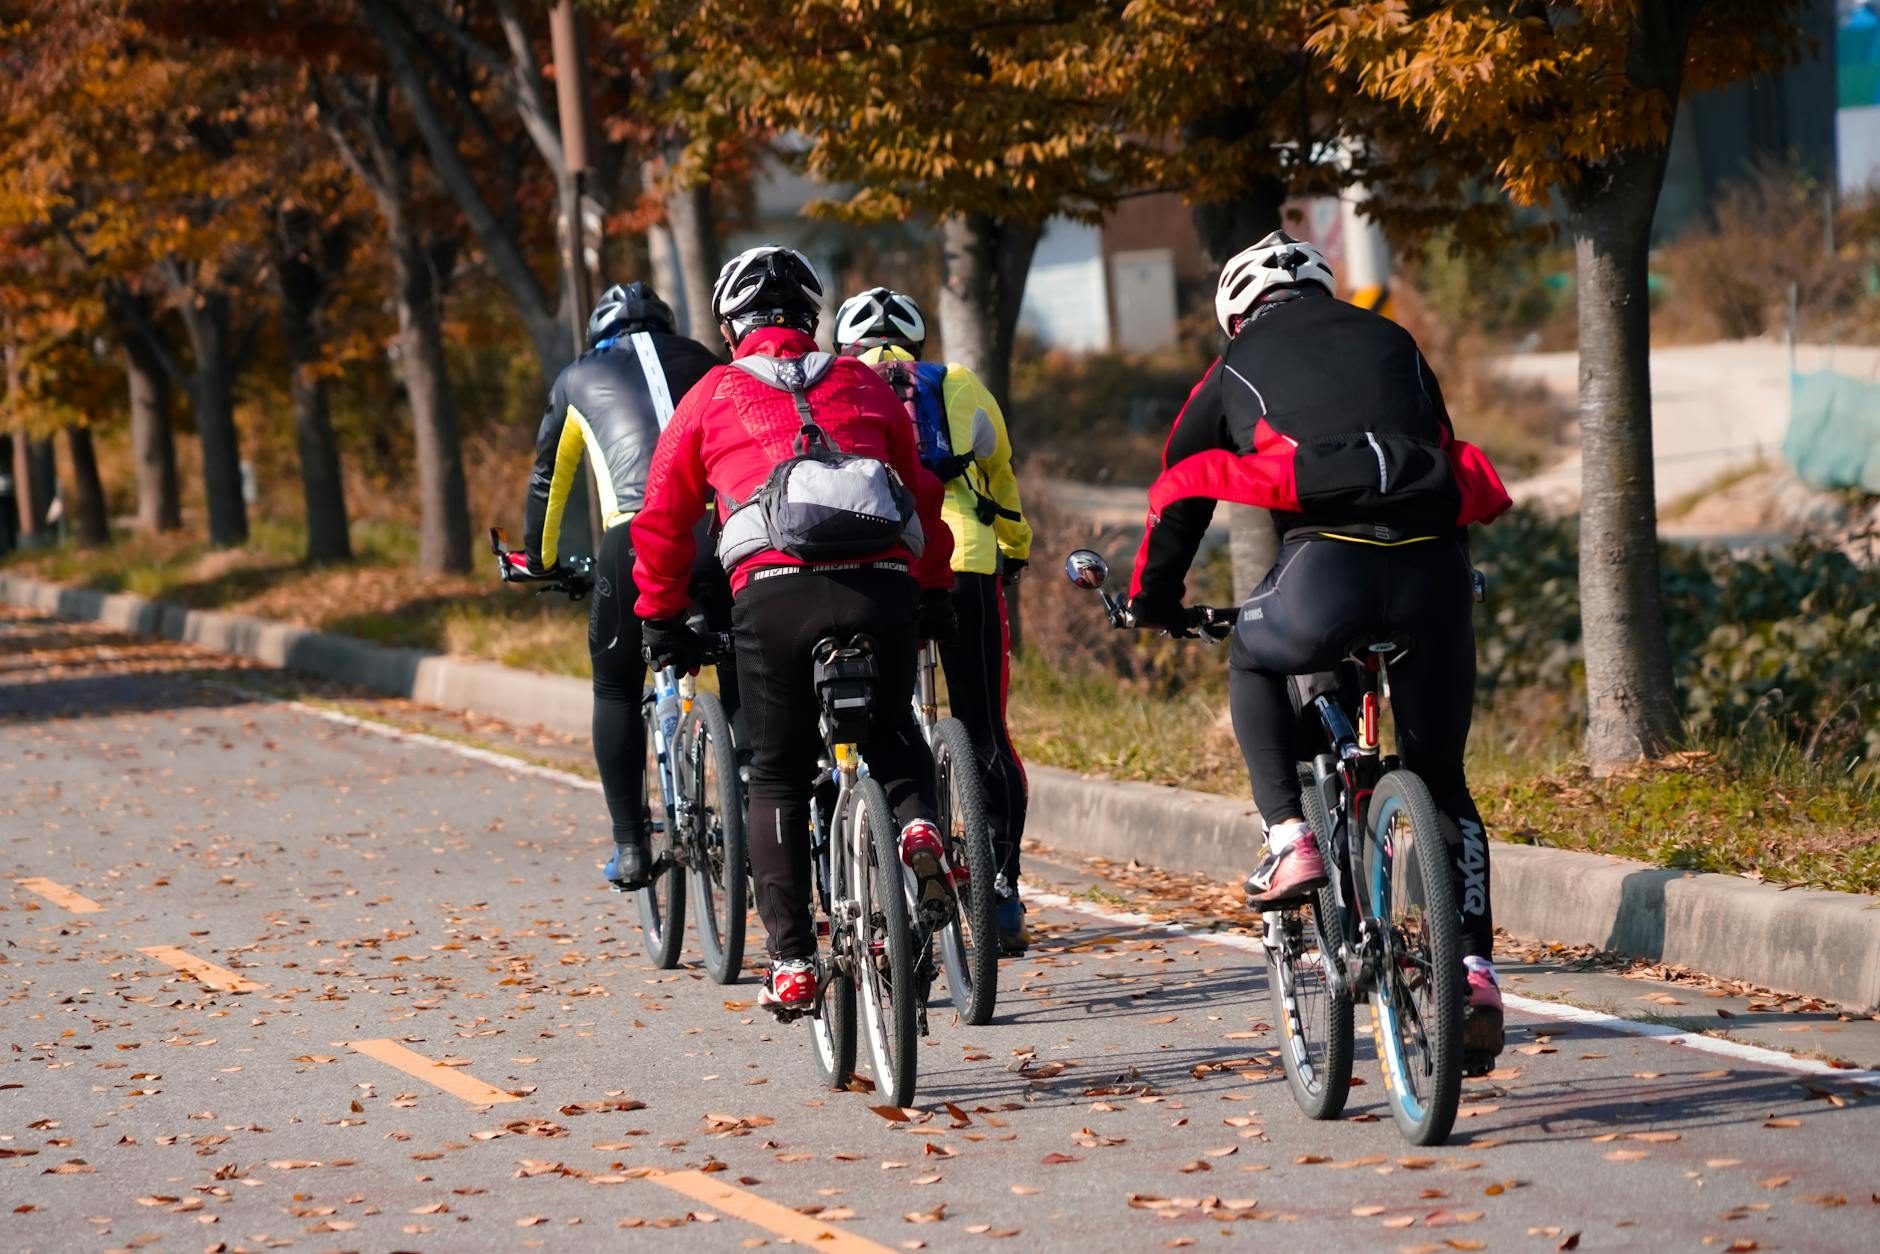
Protected bike lanes have become a rallying point for cycling advocates, and for good reason—they physically separate cyclists from traffic. However, the data reveals a hard truth: infrastructure alone cannot solve a cultural and behavioral problem. In cities with extensive bike lane networks, fatalities still occur because some drivers ignore lane markings, cyclists don’t use existing infrastructure, or the infrastructure itself has design flaws (poor drainage, obstacles, inadequate buffer widths).
Consider two cities: one invests heavily in painted bike lanes with no physical barrier, another builds protected lanes with concrete bollards. The second is demonstrably safer, but both require complementary measures: traffic calming (lower speed limits), enforcement against dangerous driving, and driver education. The tradeoff is real: building robust cycling infrastructure costs significant public resources that must come from other transportation budgets, and the political will to prioritize it remains weak in most American communities.
The Gap Between Infrastructure and Enforcement
A critical limitation in addressing cycling deaths is the enforcement gap. Speed enforcement, distracted driving penalties, and right-of-way violations involving cyclists remain inconsistently prosecuted across jurisdictions. A cyclist struck by a driver going 45 mph in a 30 mph zone may see no serious legal consequences for the driver, particularly if the cyclist’s behavior (riding without lights, for example) can be used as a defense.
This enforcement weakness undercuts the effectiveness of any infrastructure investment. Additionally, many cities lack reliable collision data broken down by bike lane usage. The National Safety Council and CDC track aggregate fatalities, but local jurisdictions often cannot answer the specific question: “What percentage of our fatal crashes involved cyclists in bike lanes?” Without this data, it’s difficult to evaluate whether new infrastructure actually saves lives in that specific location. This gap in accountability means many cities continue repeating failed approaches.
Vulnerable Road Users and the Broader Safety Crisis
Cyclists are not alone in facing disproportionate risk on American roads. Pedestrians, motorcyclists, and other vulnerable road users account for a growing share of traffic fatalities while representing small percentages of traffic.
The common denominator is that our road system prioritizes speed and vehicle throughput over safety, a design choice that became embedded decades ago and remains difficult to reverse. The rise in cycling deaths parallels rises in pedestrian deaths and motorcycle deaths, suggesting a systemic failure rather than a cycling-specific problem. A 53% increase in cycling deaths over the past decade mirrors broader trends in traffic fatality increases, indicating that the problem extends across all non-enclosed transportation modes.
What the Future Holds for Cycling Safety
The trend is troubling, but not inevitable. Cities that have invested in systematic safety improvements—lower speed limits, protected infrastructure, automated enforcement, and driver education—have seen fatality reductions. The challenge is scaling these approaches nationwide in an environment where driving culture often resists restrictions.
Autonomous vehicle adoption may eventually reduce collision rates by eliminating driver error, but that solution is years away and will not benefit current cyclists. The path forward requires coordination across multiple domains: urban planners must design safer streets, engineers must create better infrastructure, lawmakers must enforce traffic laws consistently, drivers must recognize cyclist rights, and cyclists must use available safety tools (lights, helmets, visibility). No single intervention solves the problem alone.
Conclusion
Cycling deaths in America reflect a transportation system that has failed to adapt to the presence of non-motorized users. The verified numbers—1,392 deaths in 2024, an 87% increase since 2010—are worse than many headlines suggest, and the challenge of preventing them is more complex than simply painting bike lanes. While dedicated cycling infrastructure helps, it is neither sufficient nor universally effective without supporting changes to road design, enforcement, and driving behavior. The path to safer cycling requires honest acknowledgment of these limitations and a commitment to systemic change.
If you cycle, invest in visibility (lights, reflectors, bright clothing), wear a helmet, and ride defensively. If you drive, treat cyclists as road users deserving of safe passage. If you’re in urban planning or policy, push for protected infrastructure combined with speed enforcement and driver accountability. The next cyclist who survives because of a design choice made today will likely not know it—which is exactly the point.


