Bicycles are one of the most effective tools available for building sustainable transportation systems, and the data backing that claim has never been stronger. A University of Oxford study found that switching from a car to a bike for just one trip per day reduces an individual’s transport carbon emissions by 67 percent. That single statistic captures something urban planners, climate researchers, and everyday commuters have been arguing for decades: the bicycle is not a relic of simpler times but a serious, scalable solution to some of the most pressing environmental and infrastructure challenges facing modern cities. Copenhagen offers a living case study, where cycling accounts for 45 percent of all trips and prevents an estimated 90,000 tons of CO2 from entering the atmosphere each year.
The global momentum behind cycling is accelerating. Using 2019 as a baseline, global cycling traffic has increased by 20.4 percent as of 2025, and 82 percent of the world’s population views the bicycle favorably as a mode of transportation. The global bicycle market reflects this shift, valued at approximately USD 126.7 billion in 2025 and projected to reach USD 256.51 billion by 2035, growing at a CAGR of 7.31 percent. This article examines why bicycles matter so much to sustainable transportation, how governments are investing in cycling infrastructure, where electric bikes fit into the picture, and what limitations still stand in the way of broader adoption.
Table of Contents
- Why Are Bicycles Central to Sustainable Transportation Systems?
- How Much Can Cycling Actually Reduce Carbon Emissions?
- Infrastructure Investment Is Driving a Global Cycling Boom
- Electric Bikes Are Expanding Who Can Ride and How Far
- What Barriers Still Prevent Widespread Cycling Adoption?
- Cycling Tourism Is Creating New Economic Incentives for Infrastructure
- Where Sustainable Cycling Is Headed
- Conclusion
- Frequently Asked Questions
Why Are Bicycles Central to Sustainable Transportation Systems?
The environmental argument for cycling starts at the factory floor and extends all the way to the road. bicycle manufacturing produces roughly 70 percent lower greenhouse gas emissions compared to motor vehicle production, according to research published in Nature. Once on the road, the gap widens further. Bikes emit only 0.07 pounds of CO2 per mile, accounting for both manufacturing and the food energy riders consume, compared to 0.96 pounds per mile for private cars. That is nearly a 14-to-1 ratio. No other personal transportation technology comes close to that kind of efficiency at scale. Beyond emissions, bicycles consume dramatically fewer resources in operation. They require no fossil fuels, produce no tailpipe pollution, generate negligible noise, and take up a fraction of the road and parking space that cars demand.
A single car parking spot can accommodate roughly ten bicycles. In dense urban environments where space is a premium commodity, this spatial efficiency translates directly into more livable streets, more room for green space, and less impervious surface contributing to stormwater runoff. Cities like Amsterdam and Copenhagen did not arrive at their cycling cultures by accident. They made deliberate policy choices over decades, and the environmental and quality-of-life returns have been substantial. The comparison with public transit is also worth noting. While buses and trains are far more sustainable than private cars, they still rely on significant energy inputs and infrastructure investments. Bicycles complement public transit exceptionally well, solving the so-called last-mile problem that keeps many commuters dependent on cars. A rider who bikes to a train station and then cycles from another station to the office eliminates the need for a car entirely, without requiring transit agencies to extend service into every neighborhood.
How Much Can Cycling Actually Reduce Carbon Emissions?
The numbers are compelling, but they come with important context. PeopleForBikes estimates that increasing cycling and walking mode share in the United States from 12 percent to just 15 percent could save 3.8 billion gallons of fuel and cut greenhouse gas emissions by 33 million tons per year. That is a meaningful reduction from a modest shift in behavior. It does not require everyone to sell their car or bike through a blizzard. It requires enough people to choose a bike for enough short trips to move the needle. However, these gains depend heavily on what trips cycling actually replaces. If someone bikes instead of driving a two-mile errand, the emissions savings are real and immediate.
If someone bikes instead of taking a nearly empty bus, the climate benefit is smaller. And if cycling infrastructure draws riders who were previously walking, there may be no emissions benefit at all. The greatest impact comes when cycling replaces single-occupancy car trips, particularly short ones. Research consistently shows that a large share of car trips in most cities are under five miles, well within comfortable cycling distance for most adults, and under three miles, manageable even for casual riders. Geography and climate impose real limitations. Hilly terrain, extreme heat, bitter cold, and long distances make cycling impractical for some trips in some places. No serious transportation planner argues that bicycles can fully replace cars everywhere. The argument is that in the many contexts where cycling is viable, it is dramatically underutilized, and the barriers are more often political and infrastructural than physical.
Infrastructure Investment Is Driving a Global Cycling Boom
The cities and countries seeing the biggest increases in cycling share one thing in common: they invested in protected infrastructure. Paris provides one of the most dramatic recent examples. The city invested EUR 250 million to build 180 kilometers of bike lanes, and the result was a 166 percent rise in cycling traffic. Cycling now accounts for 11 percent of trips in Paris, a city that was notoriously car-centric just a decade ago. The transformation happened fast because the infrastructure made cycling feel safe enough for people who were interested but hesitant. Ireland is pursuing an even more ambitious program, investing EUR 677 million in its National Cycle Network to create 3,500 kilometers of cycling corridors by 2030. The plan aims to connect 200 towns and serve 2.8 million people.
Belgium saw a 10 percent increase in cycling traffic in 2025 following its BeCyclist 1.0 plan. In the United States, federal funding for bike infrastructure has reached USD 1.32 billion, a figure that remains modest relative to highway spending but represents a meaningful shift in priorities. At the continental level, the European Union adopted the European Declaration on Cycling in April 2024, outlining 36 binding commitments for member states to enhance cycling infrastructure. These investments are not charity. The World Bank and the Institute for Transportation and Development Policy published a joint report in 2025, “The Case for Cycling Infrastructure Investments,” making the explicit economic argument for government spending on cycling. Protected bike lanes cost a fraction of highway expansions, reduce healthcare costs through increased physical activity, decrease traffic congestion, and generate economic activity in commercial corridors. The return on investment is consistently favorable, which is why the investment pipeline keeps growing.

Electric Bikes Are Expanding Who Can Ride and How Far
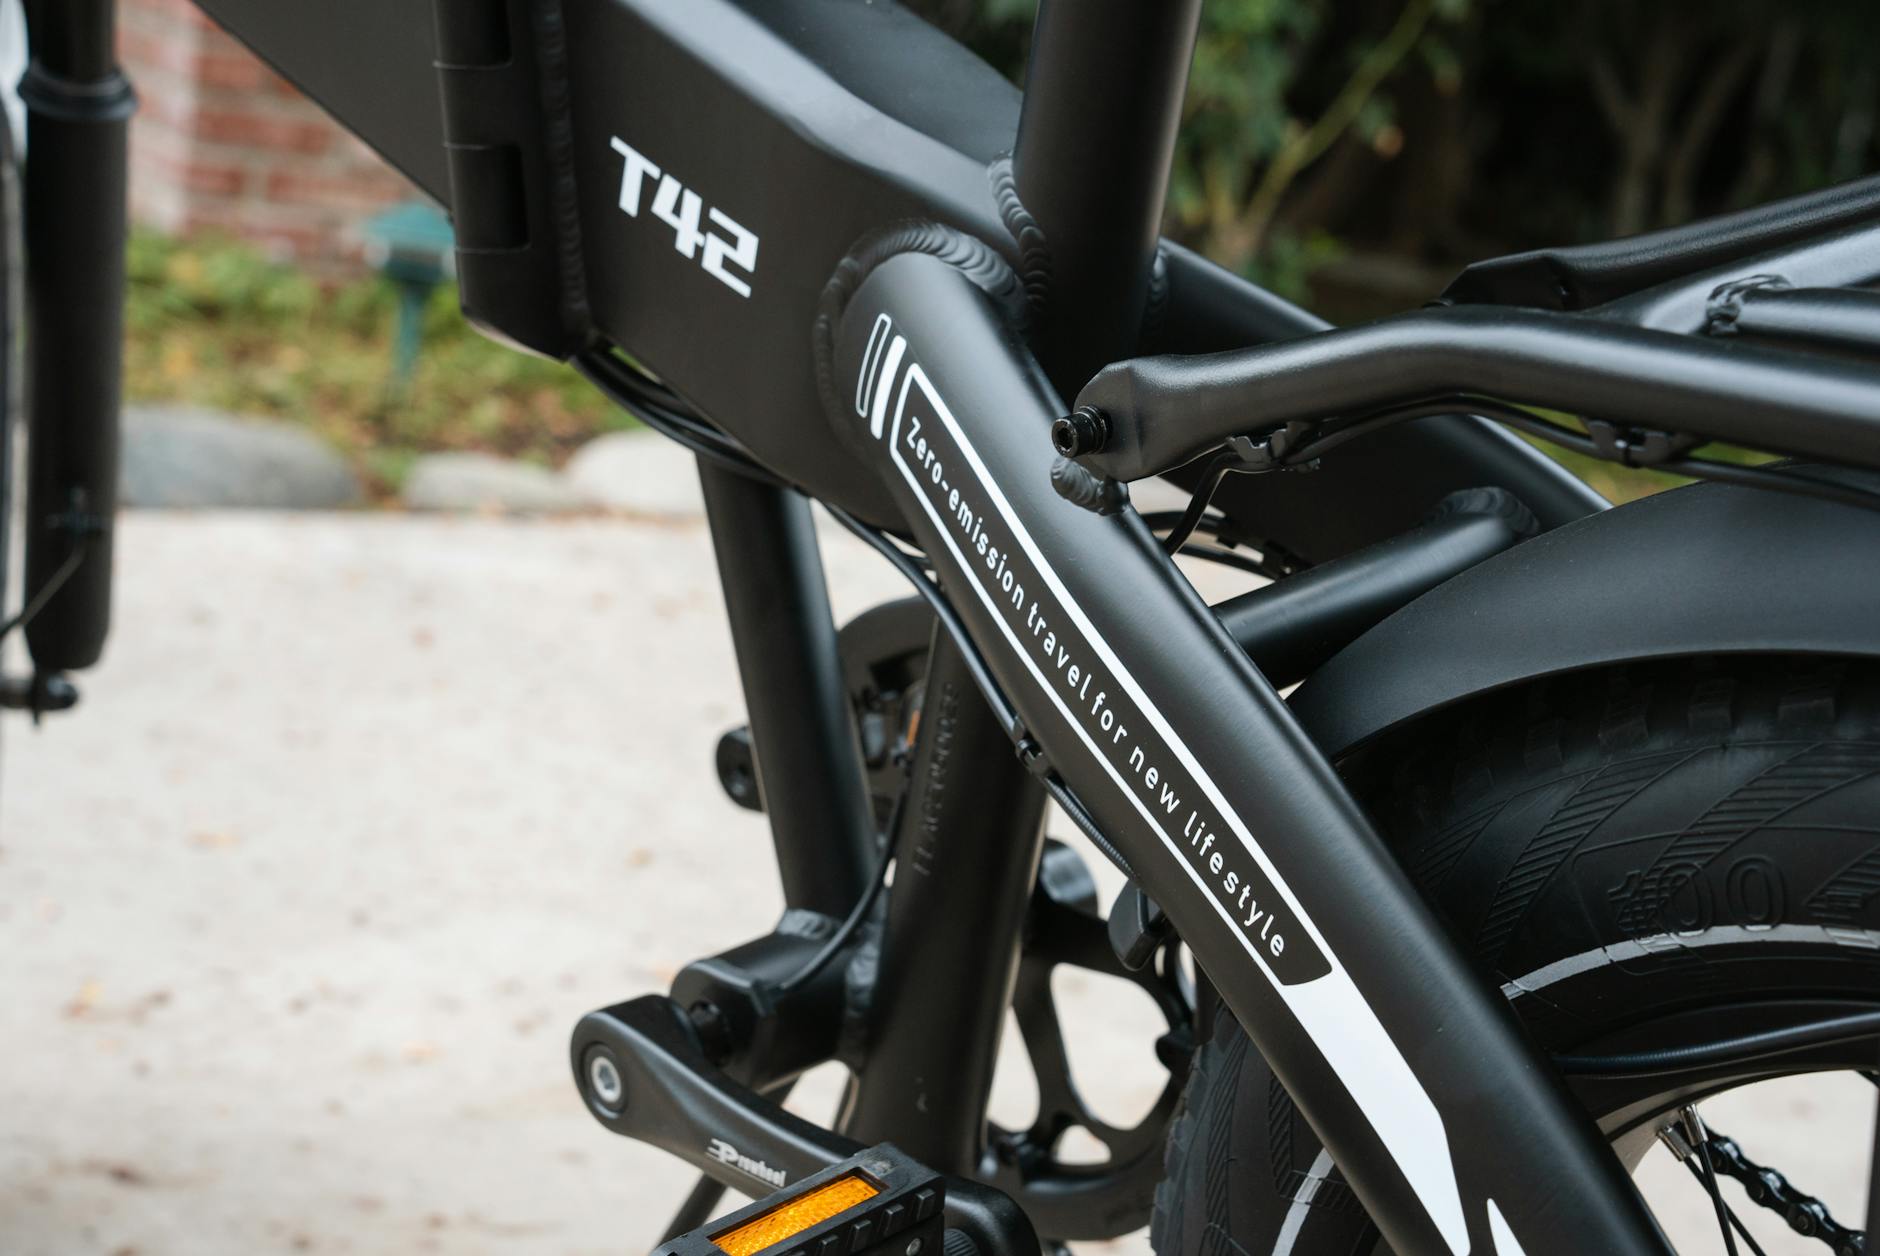
Electric bikes have changed the calculus of cycling for millions of people. Hills, headwinds, long commutes, physical limitations, and sweat are the classic reasons people give for not cycling. E-bikes address all of them. Electric bikes now represent more than 35 percent of total bicycle sales, and the global e-bike market is projected to reach USD 15 billion by 2026. That market share tells a clear story: e-bikes are not a niche product. They are becoming a default choice for a large segment of new riders. The tradeoff is cost. A quality e-bike typically runs between USD 1,500 and USD 4,000, significantly more than a conventional bicycle.
Battery production also carries an environmental footprint, including mining for lithium and other materials. Over the lifetime of the bike, the emissions savings compared to a car are still overwhelming, but the comparison to a standard bicycle is less favorable. For riders who would cycle anyway, a traditional bike is the greener option. For riders who would otherwise drive, an e-bike is a massive net positive. The key question is always what the e-bike is replacing, not just what it is. E-bikes also expand the practical range of cycling. Where a conventional bike commute might top out at five to eight miles for most people, e-bikes comfortably extend that to fifteen or even twenty miles. This brings suburban commuters into the cycling fold, a population that traditional bike infrastructure often fails to reach. Cities that want to maximize the climate and congestion benefits of cycling need to think about e-bike infrastructure specifically, including secure parking, charging stations, and lanes wide enough to accommodate the slightly higher speeds e-bikes travel.
What Barriers Still Prevent Widespread Cycling Adoption?
Safety is the single biggest barrier, and it is not primarily a matter of rider behavior. The research is consistent: people do not cycle because they do not feel safe, and they do not feel safe because they are asked to share roads with fast-moving motor vehicle traffic. Painted bike lanes, the most common form of cycling infrastructure in North American cities, offer minimal protection and do little to change the risk perception of potential riders. Protected lanes, physically separated from car traffic, are what move the needle. But they require political will, road space reallocation, and sometimes the removal of on-street parking, all of which generate opposition. Equity presents another challenge. Cycling infrastructure investments have historically favored wealthier, whiter neighborhoods. Bike-share systems often bypass low-income communities.
The cost of a reliable bicycle, let alone an e-bike, is a genuine barrier for many households. A sustainable transportation system that only serves affluent commuters is not truly sustainable. Cities making serious progress on cycling equity, such as Bogota with its extensive Ciclovia network, tend to treat cycling as public infrastructure rather than a lifestyle amenity, investing in connectivity to transit, affordable bike-share programs, and safe routes through underserved neighborhoods. Theft and secure storage remain persistent problems, particularly in dense urban areas. A commuter who cannot safely park a bicycle at their destination or store one at home faces a real practical obstacle. Apartment buildings rarely provide adequate bike storage. Workplace parking mandates almost never include bicycle facilities. These are solvable problems, but they require building codes, employer policies, and public investments that most cities have not yet prioritized.
Cycling Tourism Is Creating New Economic Incentives for Infrastructure
The economic case for cycling extends beyond commuting. The global cycling tourism market exceeds USD 190 billion in opportunities through 2035, creating powerful incentives for regions to invest in trail networks, bike-friendly accommodations, and supporting services. Europe leads this trend, with countries like France, Germany, and the Netherlands building long-distance cycling routes that attract both domestic and international visitors.
Cycling tourism tends to benefit rural and small-town economies disproportionately, precisely the kinds of communities that struggle to attract conventional tourism spending. A cyclist traveling a multi-day route stops at small-town cafes, stays in local guesthouses, and buys supplies at village shops. The economic multiplier effect is significant, and it gives local governments a concrete financial reason to support cycling infrastructure even in areas with low commuting demand. Asia-Pacific contributes over 38 percent of global bicycle demand, with Europe accounting for 29 percent, and both regions are actively expanding recreational and tourism cycling networks.
Where Sustainable Cycling Is Headed
The trajectory is clear and unlikely to reverse. Government investment in cycling infrastructure is increasing across every major region. E-bike technology continues to improve while costs gradually decline. Urban populations are growing, making the space efficiency of bicycles more valuable with each passing year.
The EU’s 36 binding commitments under the European Declaration on Cycling represent the kind of institutional framework that turns temporary political interest into durable policy. The next frontier is integration. The most effective sustainable transportation systems will not treat cycling as a standalone mode but as a fully integrated component alongside public transit, walking, and shared mobility. Cities that build seamless connections between bike networks and transit hubs, that create unified payment systems across modes, and that use data to continuously optimize infrastructure will capture the greatest benefits. The bicycle is a 200-year-old technology, and it has never been more relevant.
Conclusion
Bicycles offer an unmatched combination of environmental efficiency, spatial economy, affordability, and health benefits that make them indispensable to any serious sustainable transportation strategy. The evidence is not ambiguous. Cycling produces a fraction of the emissions of driving, requires a fraction of the infrastructure investment, and delivers measurable improvements in air quality, public health, and urban livability. Cities that have invested boldly in cycling infrastructure, from Copenhagen to Paris, have seen rapid and sustained increases in ridership that validate the approach.
The path forward requires continued infrastructure investment, better integration with public transit, equitable access across income levels and neighborhoods, and policies that make cycling safe and convenient rather than brave. For individuals, the simplest step is also the most impactful: replace one car trip per day with a bike ride. For communities and policymakers, the research from the World Bank, Oxford, and dozens of other institutions all points in the same direction. The bicycle is not a complete solution to transportation sustainability, but no complete solution exists without it.
Frequently Asked Questions
How much does cycling reduce carbon emissions compared to driving?
Switching from a car to a bike for one trip per day reduces an individual’s transport carbon emissions by 67 percent, according to a University of Oxford study. Bikes emit only 0.07 pounds of CO2 per mile compared to 0.96 pounds per mile for private cars.
Are electric bikes as environmentally friendly as traditional bicycles?
E-bikes carry a higher environmental footprint than conventional bicycles due to battery production and electricity consumption. However, they are still dramatically cleaner than cars. The key factor is what the e-bike replaces. If it replaces car trips, the net environmental benefit is substantial. If it replaces trips that would have been made on a regular bike, the benefit is smaller.
What percentage of trips are made by bicycle in major cycling cities?
Copenhagen leads with cycling accounting for 45 percent of all trips. Paris has reached 11 percent following major infrastructure investments. Most North American cities remain in the low single digits, though some, like Portland and Montreal, have made significant progress.
How much does cycling infrastructure cost compared to road infrastructure?
Protected bike lanes cost a small fraction of highway construction or expansion. Paris built 180 kilometers of bike lanes for EUR 250 million, a sum that would barely cover a single highway interchange in most major cities. The World Bank and ITDP have published research making the economic case for these investments based on favorable cost-benefit ratios.
Is cycling practical in cities with hills or harsh weather?
Hills are increasingly manageable thanks to e-bikes, which now represent more than 35 percent of bicycle sales. Cold and wet weather is less of a barrier than commonly assumed. Copenhagen and Amsterdam experience harsh winters, yet cycling rates remain high year-round due to proper infrastructure maintenance including snow clearing on bike lanes.
How fast is the global cycling market growing?
The global bicycle market is valued at approximately USD 126.7 billion in 2025 and is projected to reach USD 256.51 billion by 2035, growing at a compound annual growth rate of 7.31 percent. Asia-Pacific contributes over 38 percent of global demand, with Europe at 29 percent.


