A new study has found that e-bike riders travel approximately 340% more miles per week than traditional cyclists. Specifically, e-bike riders take trips averaging 5.7 miles in length, compared to traditional cyclists who average just 1.3 miles daily. This dramatic difference isn’t simply about speed or enthusiasm—it reflects a fundamental shift in how people use bicycles when electric assistance removes the barriers of hills, wind resistance, and fatigue. The research, conducted through an electric bike trial in Norway, reveals that when residents gain access to e-bikes, they don’t just ride further in a single trip; they fundamentally change their relationship with cycling as a mode of transportation.
Rather than treating bikes as recreational tools or fair-weather options, participants in the trial began using e-bikes for practical, everyday journeys that would have previously required a car. A commuter who once cycled 1.3 miles to a nearby store might now use their e-bike for a 5.7-mile run to a distant shop or appointment, making the journey on two wheels feel reasonable and achievable. This shift has broader implications beyond individual riders. When riders cover longer distances per trip, they’re more likely to replace car journeys entirely. The same study found that 51% of new e-bike owners report reducing their car journeys and mileage, with modal share shifting dramatically from 17% to 49% of trips being taken by two-wheeled transport after e-bike ownership—essentially cutting car use in half.
Table of Contents
- How Did E-Bikes Enable This Dramatic Increase in Weekly Cycling Distance?
- The Difference Between Daily Trip Distance and Weekly Miles
- How E-Bikes Are Replacing Car Trips
- The Real-World Requirements for Achieving These Distance Gains
- Battery Technology and Sustainability Concerns
- Who Benefits Most from Extended E-Bike Range
- The Future of E-Bike Adoption and Infrastructure
- Conclusion
How Did E-Bikes Enable This Dramatic Increase in Weekly Cycling Distance?
The 340% increase in trip distance comes down to what electric assistance actually does to the cycling experience. Traditional bicycles require riders to generate all their power through leg work, which creates natural distance limitations. A recreational cyclist might comfortably manage 20-30 miles on a weekend ride, but a daily commute of 5-10 miles feels like a serious commitment. Add hills, headwind, or the simple fatigue of a workday, and longer trips become increasingly unattractive compared to driving. E-bikes change this calculus entirely. The electric motor handles a significant portion of the work, typically providing 50-80% of the pedaling power depending on the terrain and assistance level. This means a 5.7-mile trip feels nearly as easy as a 1.3-mile trip on a traditional bike.
Riders can arrive at their destination without being drenched in sweat, breathing hard, or depleted of energy. A parent can make a 6-mile trip to pick up groceries and still have energy for the day. A commuter can ride 5 miles to work and actually arrive in a presentable state for meetings. The Denver e-bike program provides a real-world example of this principle in action. Participants in the program average 26 miles per week on their e-bikes. Low-income riders in the same program, who may have had fewer transportation options to begin with, actually ride even more—averaging 32 miles per week, which is 50% higher than the program average. This suggests that as the barrier to cycling drops, usage increases, especially among people who were previously relying on less efficient transportation alternatives.
The Difference Between Daily Trip Distance and Weekly Miles
It’s important to distinguish between trip length and total weekly mileage, as the study‘s findings work at both scales. The core finding focuses on individual trips: e-bike riders take trips nearly four times longer than traditional cyclists. But weekly totals tell a different story that depends on trip frequency. If someone takes one 5.7-mile trip per day on an e-bike, that’s about 40 miles per week. If a traditional cyclist takes one 1.3-mile trip per day, that’s about 9 miles per week. But the study findings are even more interesting because e-bike owners also take more trips overall.
The Norwegian research found that e-bike trials increased both the number of trips taken on two wheels and the distance of each trip. People weren’t simply stretching individual journeys; they were making more journeys and making them longer. One limitation worth noting: the 340% increase is specific to trip length, not necessarily a universal multiplier for all riders. A commuter who switches to an e-bike and suddenly extends their riding from a couple of miles to six or eight miles per trip may see their weekly mileage increase by far more than 340%, simply because they’re using the bike more frequently. Conversely, a recreational rider who was already cycling 20 miles on weekend rides might find that an e-bike extends their range to 30 or 40 miles per ride, but their overall frequency might not increase if they were already cycling regularly. The real gains come from people who were previously not cycling at all, or cycling very little, because traditional bikes simply didn’t work for their daily transportation needs.
How E-Bikes Are Replacing Car Trips
The significance of the 340% increase becomes clearer when you understand what trips it’s replacing. The Norwegian study didn’t just measure bike miles; it also tracked how e-bike ownership affected car use. The results were striking: modal share for two-wheeled transport increased from 17% to 49% of all trips. In practical terms, this means that once residents had e-bikes, they made cars for roughly half as many trips. This shift has real-world consequences. When 51% of new e-bike owners reduce their car use, and the average trip distance increases by 340%, you’re looking at a transportation transformation that affects everything from congestion to air quality.
A rider making a 5.7-mile trip by e-bike instead of by car saves 11 miles of driving per round trip (since they’re pedal-assisting themselves in both directions). Over a week, even occasional e-bike use adds up to significant reduction in driving. Consider a practical example: a parent in Denver who formerly drove 6 miles to pick up children from school now uses an e-bike instead. At 26 miles per week of average e-bike usage (the Denver program average), that’s 26 miles of cycling that would have been 52 miles of driving. Multiply that across thousands of riders, and the transportation impact becomes substantial. The environmental benefit is clear, but so is the personal benefit—reduced transportation costs, better health outcomes, less stress from sitting in traffic.
The Real-World Requirements for Achieving These Distance Gains
If you’re considering an e-bike with hopes of dramatically increasing your cycling distance, several practical factors matter. First, you need terrain and infrastructure that makes longer trips feasible. The Norwegian study was conducted in a country with well-developed cycling infrastructure. The Denver program operates in a growing metropolitan area with increasing bike lanes and multi-use paths. If you’re in a place where longer cycling routes don’t exist or where cars dominate the roads, even the best e-bike won’t enable the same distance increases. Second, weather plays a significant role. The 340% increase isn’t evenly distributed across seasons.
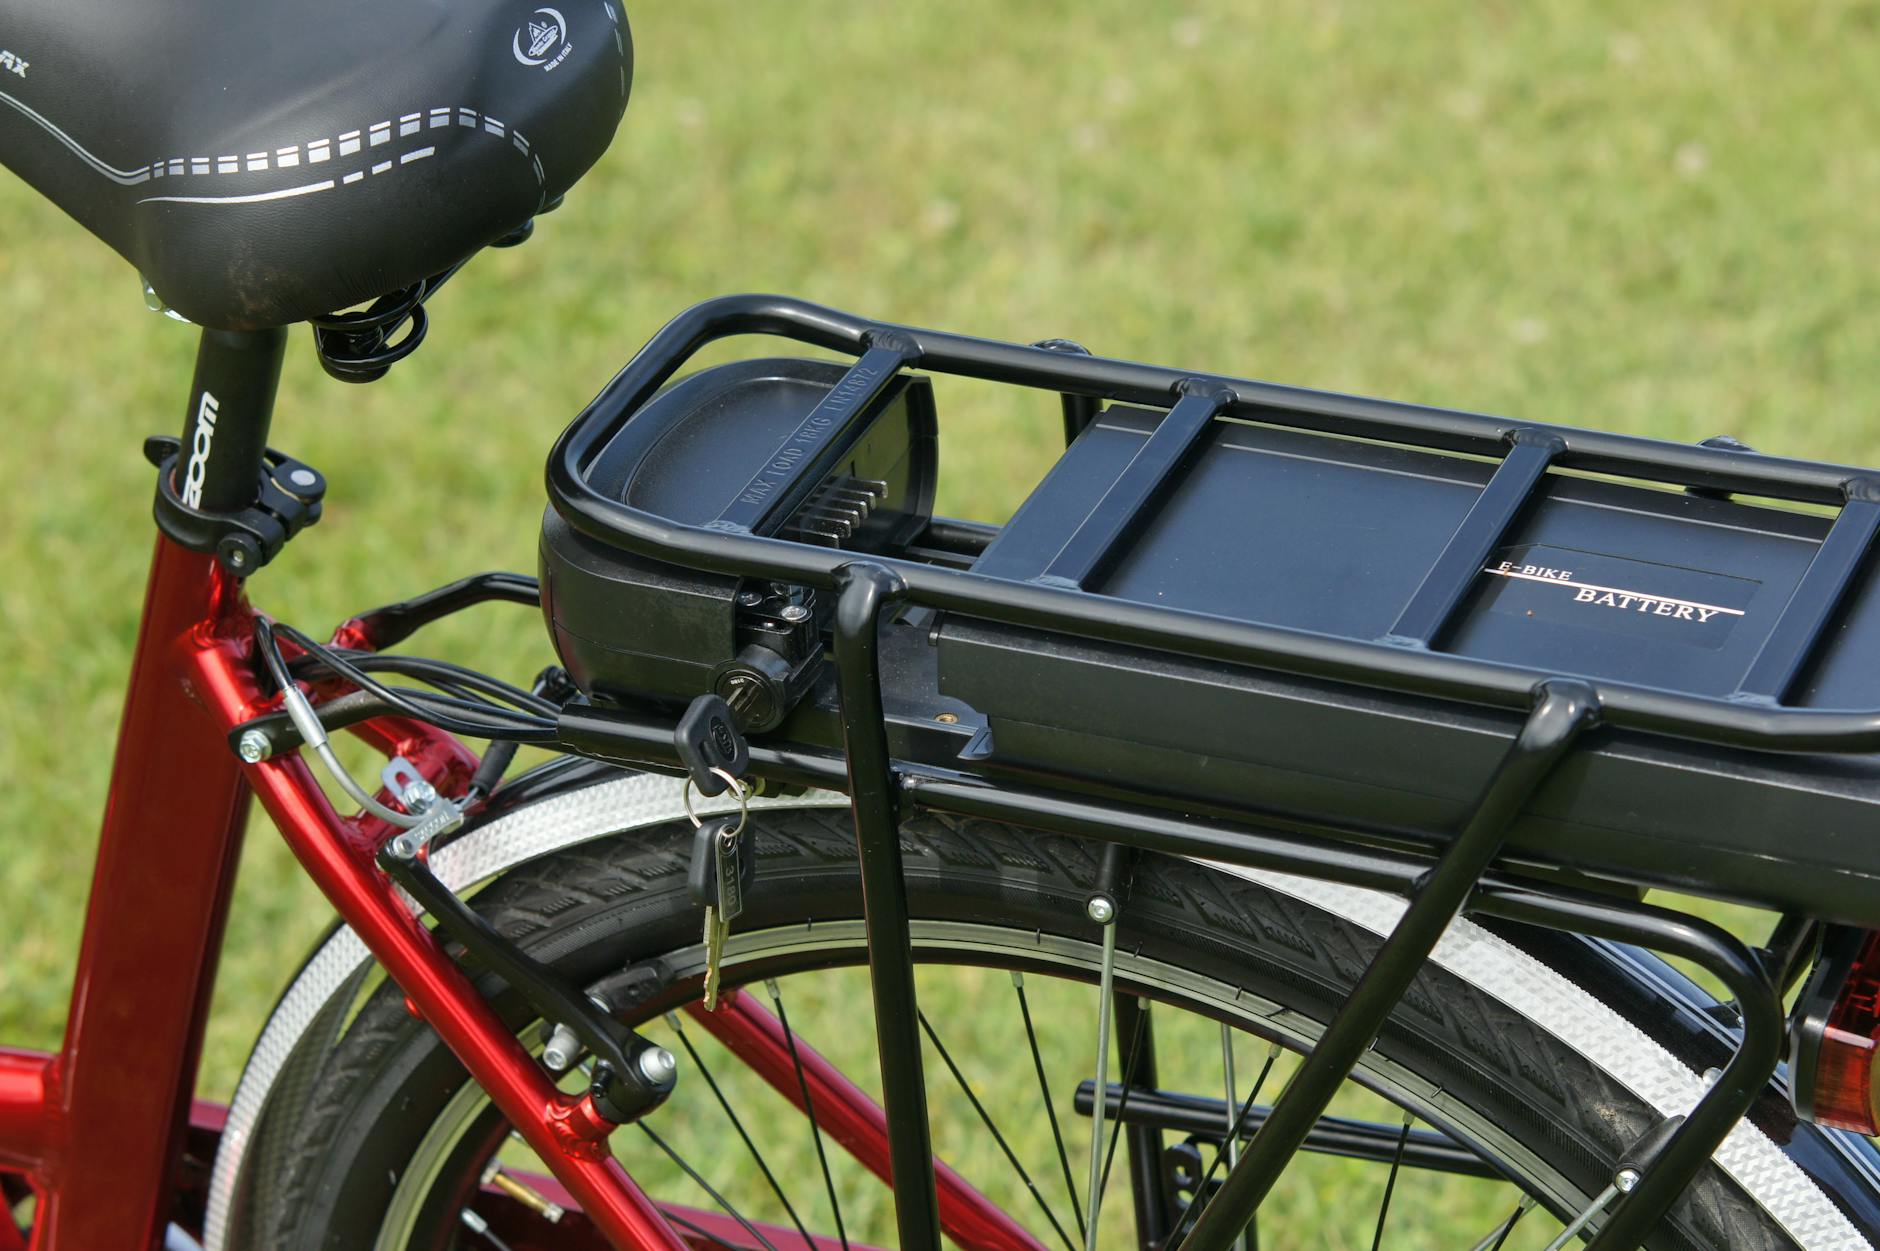
E-bike riders in snowy regions will cycle much less in winter, even with electric assistance. This doesn’t negate the study’s findings—it just means the increases are most dramatic during favorable riding seasons. A rider in a temperate climate with year-round cycling conditions will see more consistent distance gains than someone dealing with winters that effectively close down riding. Third, e-bike range and battery capacity matter practically. Most modern e-bikes can handle 25-40 miles per charge, which covers the 5.7-mile trip distance mentioned in the study even with battery power to spare. But if you’re riding at the extreme end of that range daily, you’ll be charging your battery every single day. This is manageable but worth factoring into your routine. The comparison between traditional cyclists (1.3 miles daily) and e-bike riders (5.7 miles daily) assumes that riders have access to charging and that the distances fit within their battery’s range.
Battery Technology and Sustainability Concerns
One aspect of the e-bike revolution that doesn’t always get attention is the battery cost and environmental impact. While e-bikes dramatically reduce car use—and that’s environmentally positive—they do require rechargeable lithium batteries that eventually wear out and need replacing. Typical e-bike batteries last 500-1,000 charge cycles, which translates to 3-5 years of daily riding before replacement becomes necessary. Battery replacement costs run between $400 and $1,000, depending on the bike and battery quality. This is a real consideration for riders hoping to dramatically increase their cycling mileage. If you’re riding 26 miles per week on a Denver e-bike, you’re cycling 1,300 miles annually.
At that rate, you might need a new battery every 3-4 years. Compare this to a traditional bike rider covering 65 miles annually on a standard bicycle—you’re looking at a significant increase in both environmental impact (from battery production) and financial cost. That said, the environmental math still favors e-bikes. A car that would have driven 2,600 miles annually (the replacement distance for an e-bike’s environmental impact) produces considerably more emissions and environmental damage than the manufacturing and eventual recycling of an e-bike battery. The study findings about reduced car use—going from 17% to 49% modal share by bike—make the battery lifecycle cost a worthwhile tradeoff. But it’s important to acknowledge that the increased mileage does come with real infrastructure and replacement costs that traditional cycling doesn’t require.
Who Benefits Most from Extended E-Bike Range
The Denver program data provides insight into who experiences the largest gains from e-bike access. Low-income riders in the program averaged 32 miles per week, significantly higher than the 26-mile program average. This suggests that riders with fewer transportation alternatives are more likely to maximize e-bike mileage once barriers to cycling are removed. For someone who was previously relying on public transit or occasional car access, an e-bike becomes a practical daily transportation tool that covers distances public transit may not efficiently serve.
Similarly, older adult riders benefit significantly from the distance gains that electric assistance enables. A 65-year-old cyclist may find that a traditional bike limits them to 10-15 mile rides on good days, while an e-bike allows 20-30 mile excursions to remain realistic and enjoyable. Parents making multiple trips per day—school drop-offs, errands, appointments—also see disproportionate benefits. The extended range and reduced physical demand of e-bikes makes multiple consecutive trips feasible in a way traditional bikes don’t support.
The Future of E-Bike Adoption and Infrastructure
As e-bike ownership continues to grow and studies like the Norwegian trial demonstrate their real-world impact, cities and regions are beginning to invest more seriously in cycling infrastructure. Protected bike lanes, multi-use paths, and bike parking facilities create the conditions that allow riders to achieve the kind of distance increases the study documented. Cities that invest in infrastructure see higher adoption rates and more dramatic modal shifts away from cars. Looking forward, the 340% increase in trip distance may become a conservative estimate.
As battery technology improves—with longer ranges and faster charging—and as cycling infrastructure expands, riders may be able to expand their range even further. E-bikes equipped with larger batteries or dual batteries are emerging. Charging stations in public spaces are expanding. The practical constraints that limit today’s 5.7-mile average trip length may relax significantly in the next 5-10 years, enabling even more dramatic shifts in how people move through their cities.
Conclusion
The finding that e-bike riders travel 340% more miles per week than traditional cyclists isn’t simply a statistic—it represents a fundamental shift in how people use bicycles. When electric assistance removes the barriers of fatigue and terrain, people ride farther, ride more frequently, and increasingly rely on bikes instead of cars for transportation. The Norwegian study, backed up by real-world data from programs like Denver’s, shows this isn’t theoretical.
People genuinely do change their behavior when e-bikes make longer distances practical. If you’re considering an e-bike and hoping to increase your cycling mileage, the research suggests it’s very possible. The combination of extended range, reduced physical demands, and ability to arrive fresh at your destination creates a transportation tool that works for distances and conditions traditional bikes simply don’t. The investment in an e-bike—whether from an individual budget or a community program—pays dividends not just in miles ridden, but in transformed transportation habits and reduced car dependency.


