A significant gap exists between how fast road cyclists believe they’re traveling and their actual average speeds. Research consistently shows that approximately 40% of recreational road cyclists maintain an average speed below 14 miles per hour, yet most of these same riders report believing they cruise at around 18 miles per hour or higher. This disconnect between perception and reality is rooted in how humans experience motion, how we measure speed, and the various factors that influence what feels fast versus what a device actually records.
For example, a rider completing a 20-mile weekend loop with modest climbing might feel like they’ve pushed hard the entire time, especially when tackling a few hills, yet their Garmin or Wahoo computer shows an average speed of 12.5 mph because they’ve underestimated the drag created by wind, terrain, and their own fitness level. The phenomenon is neither a failure of individual riders nor a sign of lying. Instead, it reveals fundamental truths about speed perception, how different measurement methods yield different numbers, and why even experienced cyclists can be surprised when they download their data. Understanding this gap is essential for anyone serious about improving their cycling performance, setting realistic training goals, or simply knowing whether your weekend rides are delivering the workout you think they are.
Table of Contents
- Why Do Road Cyclists Overestimate Their Speed?
- The Challenge of Accurately Measuring Cycling Speed
- What Do the Real Numbers Tell Us About Cycling Speed?
- Training Strategies to Increase Your Actual Average Speed
- Mistakes That Keep Cyclists Underperforming Their Potential
- Technology and Metrics for Honest Self-Assessment
- The Road Ahead—Why Speed Is Only Part of the Picture
- Conclusion
Why Do Road Cyclists Overestimate Their Speed?
The human perception of speed is unreliable by design. When riding a bike, your brain relies on visual cues—how quickly the road passes beneath you, landmarks sliding by, your breathing rate, and muscle fatigue—to estimate velocity. On a quiet country road with long sight lines, 12 mph can feel brisk. In an urban environment with frequent stops, a 14 mph segment feels racing-fast. Neither perception is wrong; they’re just incomplete. Additionally, cyclists tend to remember the fastest moments of a ride—the downhill sprint, the tailwind section, the fresh-legs opening miles—and mentally weight these moments more heavily than the slower grinding through a headwind or the climb where speed drops to 8 mph.
A 40-mile ride with 20 miles at 16 mph and 20 miles at 10 mph averages 13 mph, but the rider remembers the fast half and discounts the slow half, mentally averaging closer to 15 or 16. Fitness level also distorts perception. A rider who is newly capable of maintaining what feels like a high effort will interpret that effort as correlating with high speed. If you’re pushing hard aerobically, breathing heavily, and sweating, your mind associates that with “fast.” For untrained riders, 12 mph on flat ground might require genuinely hard effort, so it feels like speed. For trained riders, 12 mph requires almost no effort, so they assume their “real” speed while riding hard is much higher—perhaps 18 or 20 mph—because they’re conflating effort with velocity. A casual rider doing a neighborhood loop at moderate effort might report 16 mph average; that same neighborhood loop by a fit rider would likely show 18 to 22 mph because the fit rider can sustain higher speeds with similar perceived effort.
The Challenge of Accurately Measuring Cycling Speed
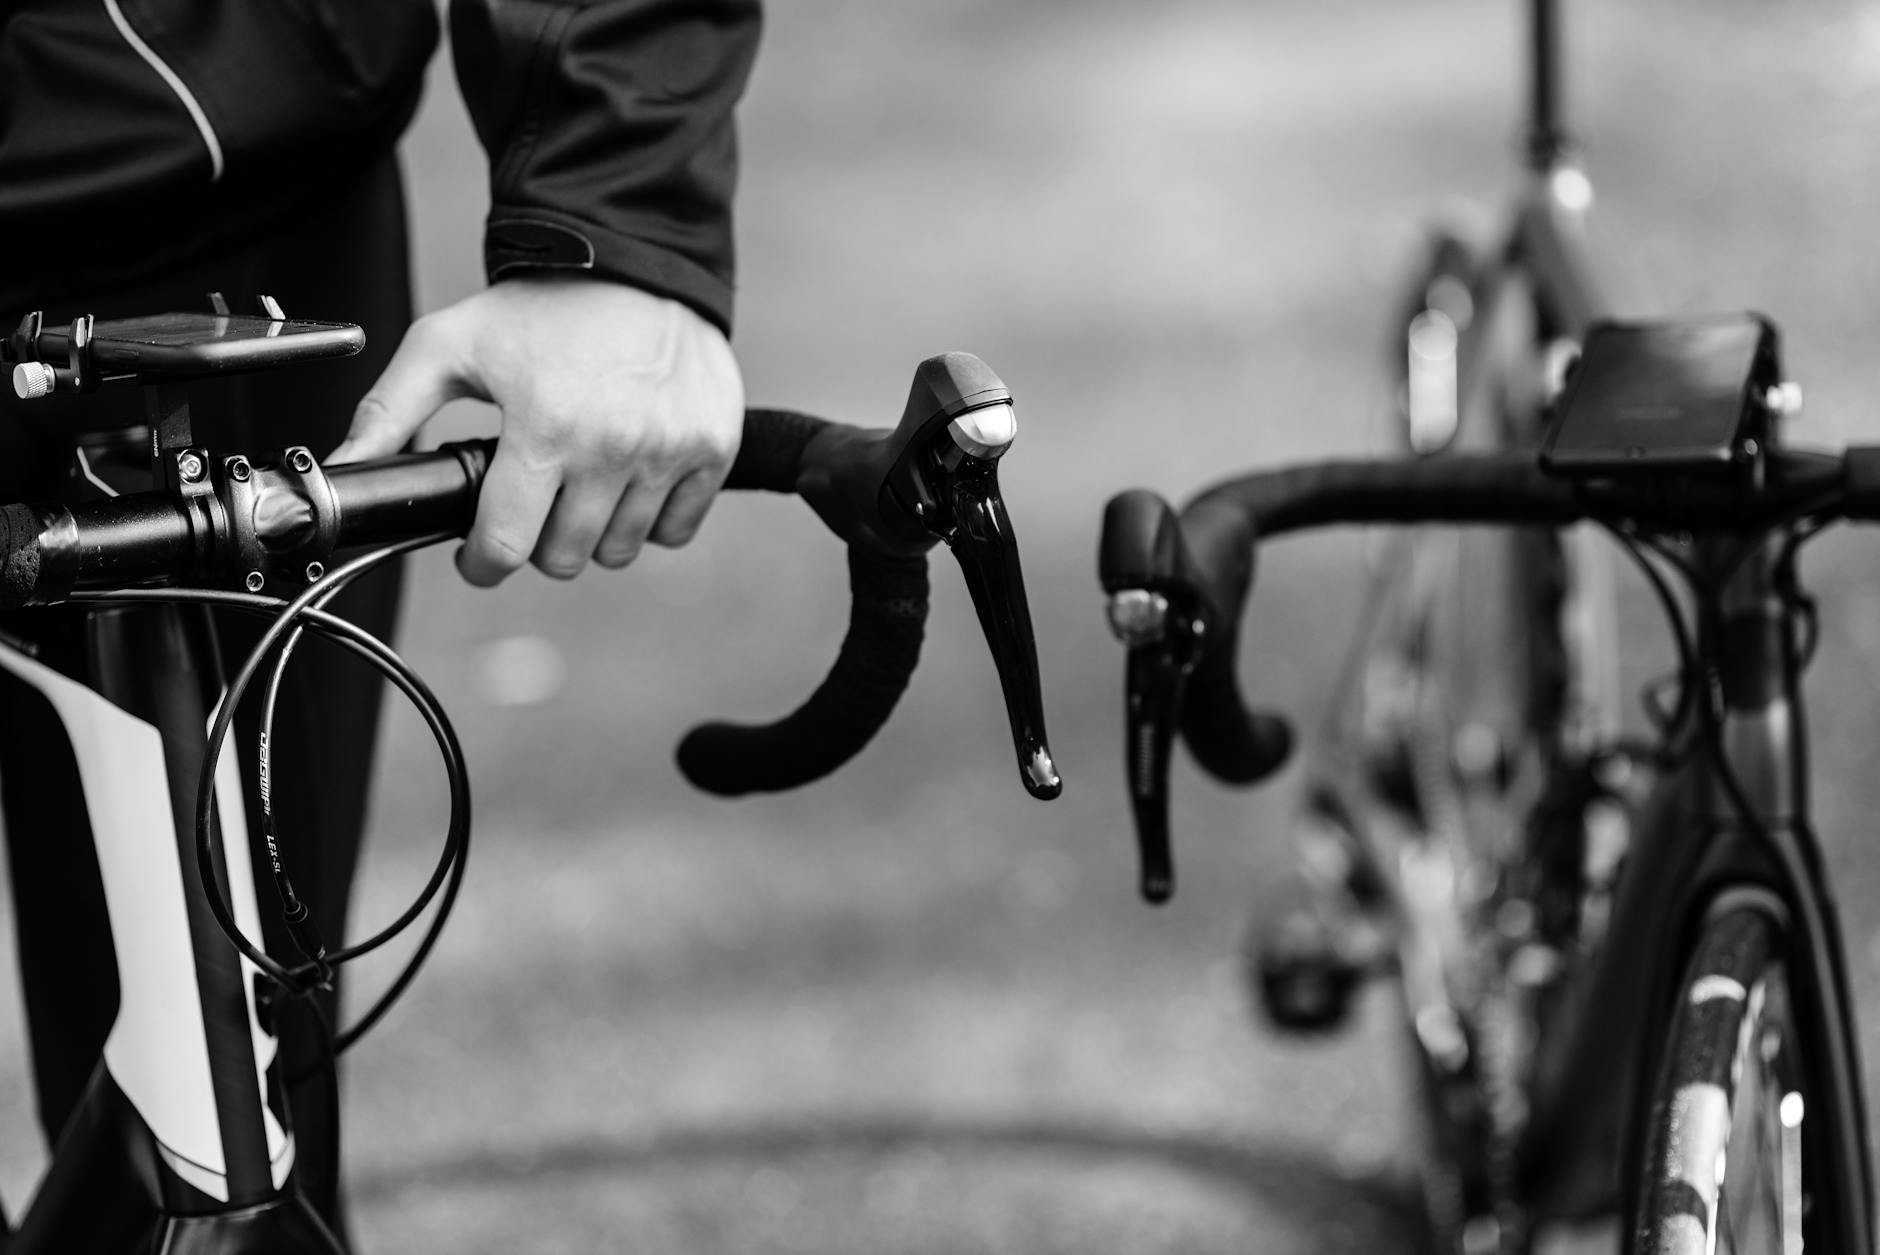
Modern cyclists have access to better speed data than ever, yet many don’t use it correctly or at all. A basic bike computer or smartphone app running Strava provides GPS-based speed, which is the gold standard for determining true average speed. However, many casual cyclists rely on gut feel, watch the speedometer briefly during climbs or descents, or misunderstand how average speed is calculated. GPS measures the distance you traveled divided by the time elapsed, including every pause, stop sign, and slow climb. A rider who averages 14 mph for a full hour of riding time has genuinely averaged 14 mph, but if they mentally exclude a 10-minute coffee break from their calculation, they might convince themselves the riding portion averaged 15 or 16 mph.
The limitation here is that different measurement methods yield different answers. A speedometer shows instantaneous speed, which is psychologically memorable (you notice when it hits 25 mph downhill) but irrelevant to your actual performance. Power meters, used by serious cyclists, measure effort in watts rather than speed, which depends heavily on terrain and conditions—200 watts might be 18 mph on flat ground and 6 mph on a steep climb. Heart rate doesn’t correlate directly with speed either; a steady Zone 2 effort can produce widely variable speeds depending on terrain. For cyclists without a power meter or GPS computer, this creates a vacuum where perception fills in the gaps. A rider climbing at 8 mph with an elevated heart rate might feel like they’re working hard and assume this is their typical riding speed, ignoring the fact that they spend more total time at 12 to 14 mph on less demanding terrain.
What Do the Real Numbers Tell Us About Cycling Speed?
Actual data from cycling platforms reveals a wide distribution of average speeds, with recreational road cyclists typically clustering between 10 and 16 mph. Strava segments and ride summaries show that most non-racing cyclists on casual weekend rides—the people who might describe themselves as “regular cyclists” rather than racers—complete rides with average speeds in the 11 to 15 mph range. This includes all terrain, weather, and conditions. Rides on windy days, rides with significant climbing, rides shared with friends at conversation pace, and solo pushes all blend into a single average. A 50-mile route with 3,000 feet of elevation gain will produce a notably lower average than a flat 30-mile route, yet both might be done by the same rider with similar fitness.
Elite amateur cyclists and strong club racers typically average 18 to 24 mph on road rides. Professional cyclists in training average 22 to 28 mph. The gap between a fit recreational rider (15 mph average) and a strong amateur (20 mph average) is often smaller than the gap between fitness levels implies, because speed is sensitive to terrain, wind, group dynamics, and pacing strategy. A recreational rider doing a solo flat 20-mile loop might average 15 mph; that same rider riding with a group on the same loop might average 17 to 18 mph due to the drafting benefit. The data also reveals that women and men overlap significantly in speed distributions, with fitness and training being far more deterministic than gender, despite lingering stereotypes. A fit female recreational cyclist will average higher than an unfit male recreational cyclist every time.
Training Strategies to Increase Your Actual Average Speed
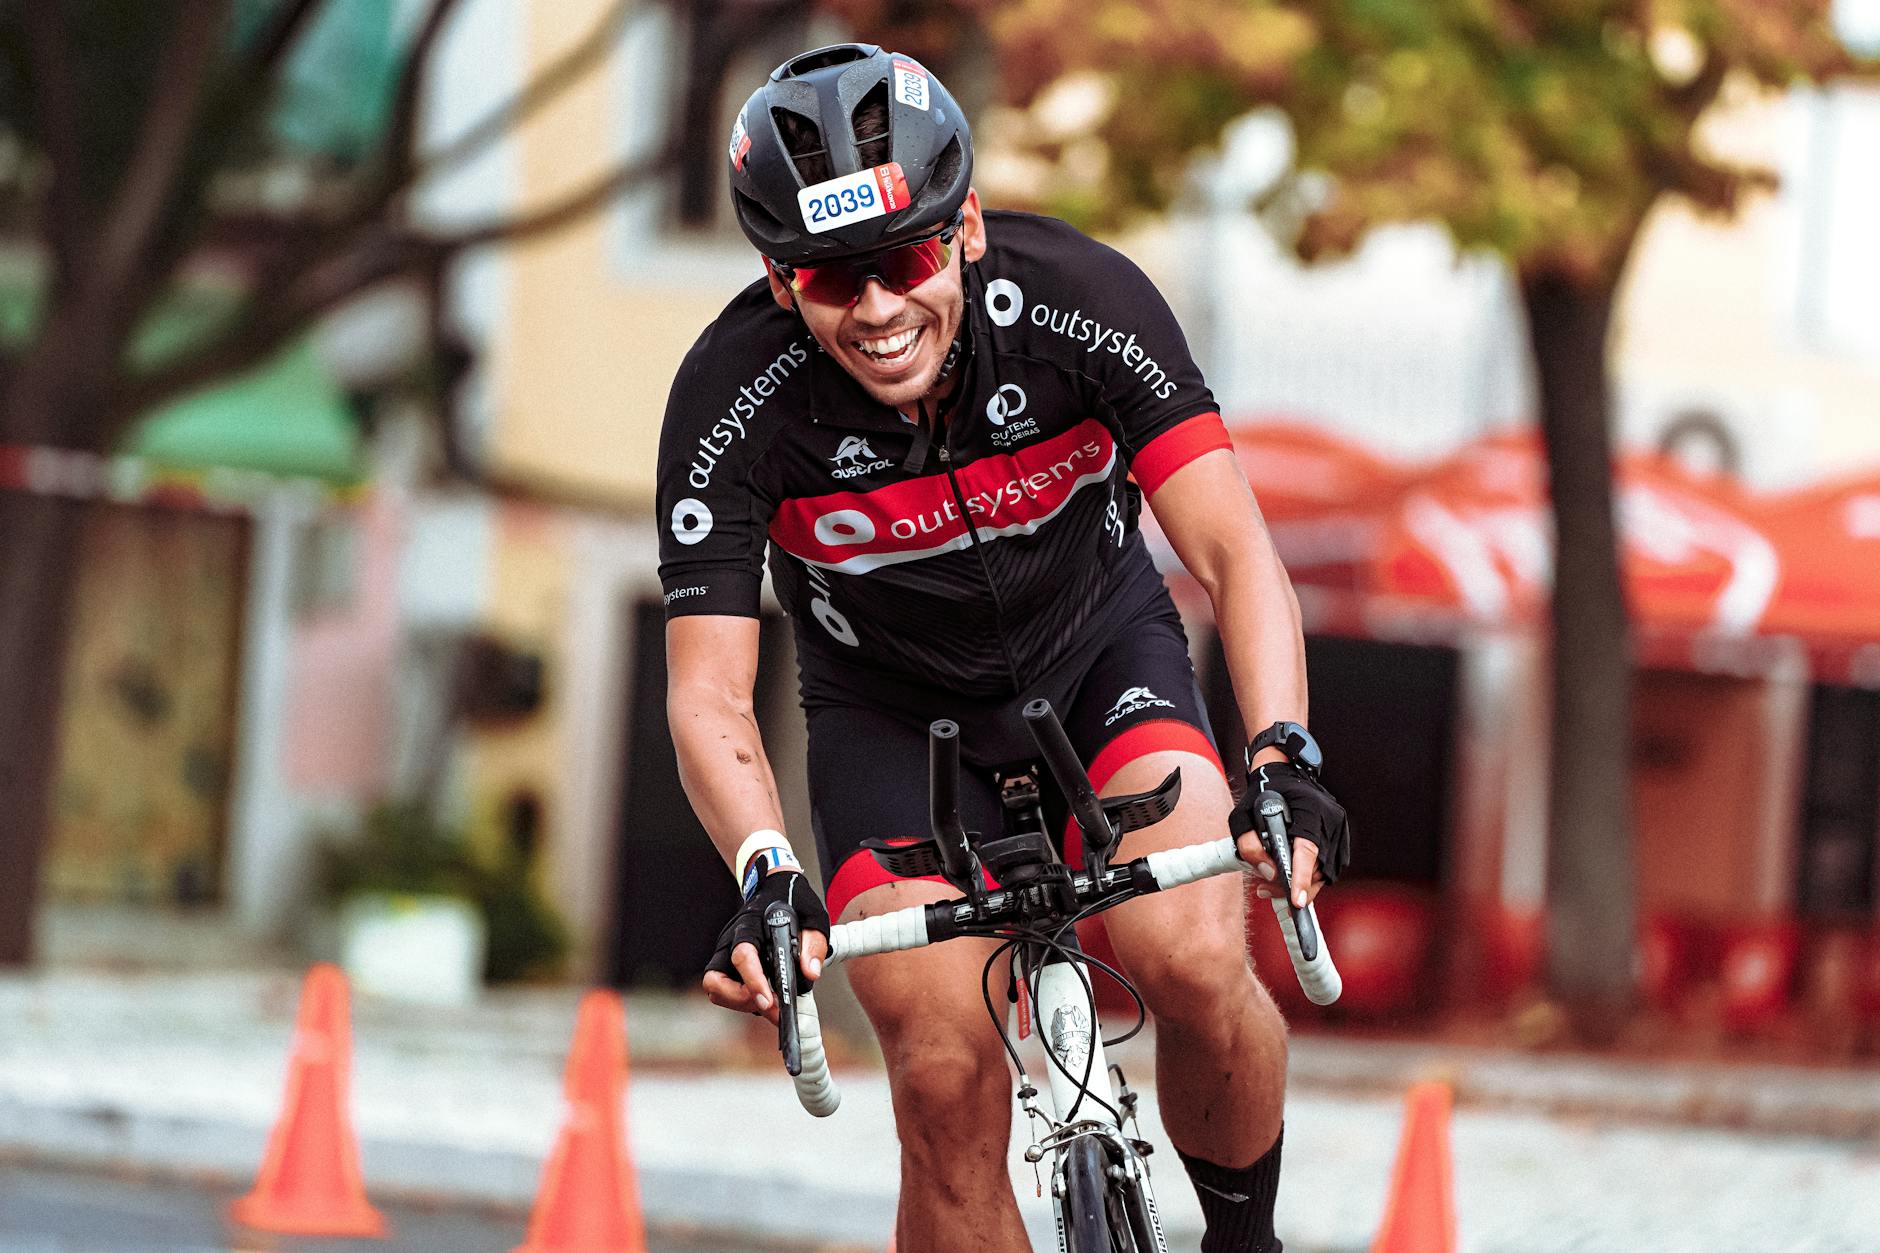
If your GPS data shows you’re averaging 12 mph and you want to improve, the most effective approach combines specific training, attention to fitness, and strategic route selection. Threshold training—riding for sustained periods just below your maximum sustainable effort—is the gold standard for increasing functional speed. A threshold workout might involve 20 minutes at a pace that produces an average speed of 16 to 17 mph, which is faster than your usual comfortable pace but sustainable. Over 12 weeks of consistent threshold work, riders typically see their baseline “comfortable” speed increase by 2 to 3 mph. For example, a rider averaging 12 mph on casual rides might reach 14 to 15 mph after a structured training block, and eventually 16 to 17 mph with continued work. Interval training also improves average speed by raising your sustainable power output.
Short, hard efforts repeated with recovery between them teach your body to produce and sustain higher speeds. A simple session might be 6 x 3 minutes at a hard pace with 2 minutes easy spinning between repeats. This doesn’t directly improve your casual cruise speed, but it increases your fitness ceiling, which has a spillover effect on everything you do. The tradeoff is that this training is harder, requires more recovery, and isn’t sustainable as your primary training method. Many riders find that mixing threshold work with group rides delivers the best results because group rides naturally push you harder without the mental burden of self-directed interval training, and they’re more enjoyable. The comparison: solo tempo training might increase your average by 2 mph in 8 weeks; group rides might achieve the same gain in 10 weeks but with better adherence and lower injury risk because they feel less like work.
Mistakes That Keep Cyclists Underperforming Their Potential
One of the most common errors is confusing average speed with typical speed or peak speed. Many casual cyclists will ride for 90 minutes, notice their speedometer reading 16, 17, or 18 mph during the fast parts, and conclude they’re averaging that speed. When their Strava file shows 13 mph average, they assume the app is broken. The app isn’t broken; they’ve simply failed to account for the 6 mph climbs, the 11 mph into-the-wind sections, and the brief pauses that all mathematically drag down the average. A warning: if you’re using average speed as a metric for fitness gains, ensure you’re comparing like with like. A 14 mph average on a hilly route is not comparable to a 14 mph average on a flat route; you can’t determine if your fitness improved without controlling for terrain.
Another mistake is neglecting aerodynamics and equipment. A rider on a heavy hybrid bike with upright posture, wide tires, and internal cable routing will average 1 to 2 mph slower than an identical rider on a light road bike with drop bars and thin tires, all else equal. This isn’t fitness; it’s friction. Tire pressure, drivetrain cleanliness, and brake alignment all matter in aggregate. A third warning: chasing speed while ignoring effort level is a recipe for overtraining. If you’re consistently riding at an intensity that leaves you exhausted and unable to recover, your average speed will stagnate or decline as your body depletes glycogen and motivation. Many recreational cyclists would improve faster by riding more consistently at a moderate pace than by repeatedly attempting to push hard and then taking unplanned recovery days.
Technology and Metrics for Honest Self-Assessment
GPS cycling computers and smartphone apps have democratized speed data, removing the excuse that you don’t know your real numbers. A basic $50 device or free app like Strava provides GPS-based speed, distance, and elevation data. The utility of these tools is diminished only if you don’t engage with the data. Downloading your ride and reviewing the numbers—not just the headline average, but the segment-by-segment breakdown—builds awareness. You’ll notice that your typical return-on-the-same-road-home average is consistently 2 mph slower than your outbound average, revealing wind or terrain bias. You’ll see that rides where you felt fast often averaged slower than rides that felt like grinding. Over time, this feedback loop corrects the perception-reality gap.
Power meters provide the most objective measure of effort, but they’re expensive ($300 to $1,500 depending on type) and unnecessary for most recreational cyclists. A basic heart rate strap offers a middle ground, correlating effort to zones, though heart rate is affected by fatigue, caffeine, and heat. For most riders interested in improving average speed, a simple GPS device and the discipline to review data monthly is sufficient. The example: a rider who tracks their rides monthly might notice that May’s average increased from 13 to 13.5 mph despite feeling the same effort. In June, they attribute a jump to 14 mph to better fitness, but reviewing the weather data and routes reveals they rode on consistently windless days on flatter courses. By July, when conditions return to baseline, they’re disappointed that their “improvement” disappeared. This is the value of honest data: it prevents misattribution and keeps you focused on real fitness gains.
The Road Ahead—Why Speed Is Only Part of the Picture
As cycling technology evolves, the average cyclist will have access to better and better performance data. Aerodynamic simulation, real-time power feedback, and AI-assisted coaching are already available to those willing to pay for them. Yet this abundance of data paradoxically makes honest self-assessment both easier and harder. It’s easier to know exactly how fast you’re going; it’s harder to accept numbers that contradict your self-image. A recreational cyclist in 2026 who averages 12 mph on mixed terrain is doing nothing wrong and is getting tremendous aerobic benefit, yet will likely feel disappointed after reading that others average 15 or 18 mph.
The forward-looking insight is that cycling satisfaction matters more than average speed. The most consistent cyclists aren’t always the fastest; they’re the ones who set realistic expectations, experience visible progress, and find the activity enjoyable. A rider who improves from 11 mph average to 13 mph average over a year experiences a 18% gain in speed and a massive confidence boost. That same rider comparing themselves to a cyclist who’s always averaged 18 mph learns nothing useful about their own progress. Communities and platforms are increasingly focusing on personal progress metrics and power-based training zones rather than absolute speed, which is a healthy shift for keeping cyclists motivated without delusion.
Conclusion
The fact that 40% of road cyclists average under 14 mph while believing they average 18 mph isn’t a failure of the cyclists—it’s a predictable result of how human perception works and how unevenly speed data is distributed among the cycling population. Perception of speed is subjective, influenced by effort, terrain, group dynamics, and memory. The most reliable correction is to use GPS-based data to understand your actual numbers, including the variation across different routes and conditions. This honesty creates the foundation for meaningful improvement.
If your goal is to increase your average speed, the path is clear: structured training, consistent riding, and attention to aerodynamic factors deliver measurable gains. If your goal is simply to enjoy cycling and ride regularly, that’s equally valid and requires no apology. The critical step is downloading your ride data, comparing it to your perception, and adjusting your expectations. Once you know you’re averaging 12 mph, you can decide whether to train to increase it or simply appreciate the aerobic work you’re doing at that pace. Either way, you’ll be working from truth rather than assumption.


