Cities around the world promote bicycle transportation through a combination of protected infrastructure, financial investment, bike-sharing systems, speed reduction measures, and e-bike integration — and the results are reshaping urban mobility at a pace few predicted. Paris, for instance, has seen cycling traffic increase 240% between 2018 and 2023 after building over 1,000 km of cycling infrastructure and committing €250 million to its cycling program through 2026. The city now sees 11.2% of intra-city trips made by bicycle, compared to only 4.3% by car — a reversal that would have seemed implausible a decade ago.
The scale of this shift is global. As of late 2024, 9.28 million shared bikes operate across 2,145 bike-sharing systems in 1,700 cities spanning 92 countries, with approximately 18.6 million shared bicycles deployed worldwide, including 7.4 million electric bikes. The global bike-sharing market alone is estimated at $7.83 billion in 2025 and projected to reach $11.85 billion by 2030. This article examines the specific strategies that cities from Utrecht to Brooklyn are using to get more people on bikes, the investment levels that actually move the needle, and the limitations and tradeoffs that come with each approach.
Table of Contents
- What Strategies Do Cities Use to Promote Bicycle Transportation?
- How European Cities Lead in Cycling Infrastructure Investment
- Paris and the 100% Cyclable City Model
- How U.S. Cities Are Closing the Cycling Gap
- The Limitations and Risks of Bike-Sharing Systems
- E-Bikes as a Game Changer for Urban Cycling
- Where Cycling Promotion Is Headed
- Conclusion
- Frequently Asked Questions
What Strategies Do Cities Use to Promote Bicycle Transportation?
The most effective cities share a common playbook, even if their starting points differ. Protected or separated bike lanes — physically divided from motor traffic by curbs, planters, or bollards — form the backbone. Speed reduction and traffic calming measures make streets safer for everyone. E-bike subsidies and integration into bike-sharing fleets extend the practical range of cycling. And bike-sharing systems, whether docked or dockless, lower the barrier to entry for people who do not own a bicycle.
Top-rated cycling cities typically invest between $20 and $50 per resident annually on cycling infrastructure, and studies show that every $1 invested in cycling infrastructure generates $11 in benefits through reduced healthcare costs, lower congestion, and economic activity. What separates the leaders from the rest is not just the presence of these elements but the proportion of spending directed at protection. Top U.S. cities now dedicate 85 to 90 percent of their cycling budgets to protected infrastructure rather than painted bike lanes or signage alone. The distinction matters because painted lanes, while cheap, do little to attract the broad population of potential cyclists who cite safety as their primary concern. Copenhagen illustrates the endpoint of this approach: the city boasts 52 km of protected cycle paths per 100 km of roadway, the highest infrastructure density in the world, and targets a 50% modal share for cycling on work and education trips.

How European Cities Lead in Cycling Infrastructure Investment
Europe dominates the top ranks of cycling cities, and the numbers explain why. Utrecht in the Netherlands tops the 2025 Copenhagenize Index globally, with nearly one-third of all trips made by bicycle and annual investment of €63 per resident in cycling infrastructure. Amsterdam sees 37% of all trips made by bicycle. Copenhagen has integrated its cycling strategy with its goal to become the first carbon-neutral capital, treating cycling not as a recreational amenity but as essential climate infrastructure. However, even European leaders face real challenges.
Amsterdam is actively working to address new complications from e-bikes, congestion on cycle paths, and the impact of tourism on cycling infrastructure. Faster e-bikes sharing paths with traditional cyclists create speed differentials that require design solutions — wider lanes, separated fast and slow tracks, or speed limits within cycling infrastructure itself. Ghent, Belgium, took a different approach by implementing a bold circulation plan that transformed car-focused streets into cyclist and pedestrian-priority spaces, essentially redesigning traffic flow across the city center. Belgium as a whole saw a 10% increase in cycling in 2025 through its BeCyclist 1.0 plan, with BeCyclist 2.0 in development. The lesson from Europe is that sustained, high per-capita investment over years or decades produces results, but those results create second-order problems — crowded bike lanes, conflicts between user types, and infrastructure that needs constant adaptation — that cities earlier in their cycling journeys should plan for from the start.
Paris and the 100% Cyclable City Model
Paris deserves its own examination because it represents the most dramatic transformation of a major city’s cycling landscape in recent history. Under Plan Vélo I (2015–2020) and Plan Vélo II (2021–2026), the city aims to become fully cyclable by 2026. The commitment is not abstract: over 1,000 km of cycling infrastructure built since 2015, 180,000 new bike parking spots being added to the existing 60,000, and €250 million committed through 2026. The 240% increase in cycling traffic between 2018 and 2023 happened alongside a decline in car traffic, suggesting genuine mode shift rather than simply adding cyclists to unchanged car volumes.
What makes Paris instructive is that it started from a low base relative to Dutch or Danish cities and achieved rapid change through political commitment and infrastructure spending. The city’s experience suggests that the “our city is different” argument — often deployed against cycling investment in car-oriented cities — has limits. Paris had narrow medieval streets, aggressive drivers, and a car-centric culture, and it changed anyway. The tradeoff was real political conflict over parking removal and road space reallocation, a cost that cities considering similar transformations should expect rather than hope to avoid.

How U.S. Cities Are Closing the Cycling Gap
American cities have historically lagged far behind their European counterparts, but recent data shows meaningful acceleration. In the PeopleForBikes 2025 ratings, 234 U.S. cities scored 50 or above, up from 183 in 2024, and 80% of rated cities improved their scores since 2020. Brooklyn, New York achieved the highest rating ever recorded for a major U.S. city at 73 points. Perhaps more striking is Saint Paul, Minnesota, which jumped from 9 points in 2020 to 62 points in 2025 — the most dramatic improvement in the dataset and evidence that rapid change is possible even in cold-weather, car-oriented cities. Cambridge, Massachusetts offers another model.
Its Cycling Safety Ordinance legally requires building nearly the entire citywide protected bike lane network by 2026, turning cycling infrastructure from a discretionary budget item into a legal mandate. This approach removes the year-to-year political vulnerability that cycling projects face in most American cities. E-bike adoption is amplifying the impact of new infrastructure: usage surged 300% in cities like San Francisco and Seattle, with average trip length increasing from 2.5 to 8 miles. That range expansion matters because it brings cycling into competition with car trips that traditional bicycles could not practically replace. The comparison between U.S. and European approaches reveals a key tradeoff. European cities generally built cycling cultures over decades with sustained moderate investment. American cities attempting to compress that timeline face higher political resistance per mile of infrastructure but benefit from newer design standards and the e-bike revolution that extends cycling’s practical reach.
The Limitations and Risks of Bike-Sharing Systems
Bike-sharing is often treated as a silver bullet, but its track record is mixed. The global fleet of approximately 18.6 million shared bicycles, with about 40% electrification, represents enormous investment, yet many systems struggle with financial sustainability, vandalism, and equitable distribution. Dockless systems in particular have created backlash in cities where sidewalks became cluttered with abandoned bikes, leading to regulatory crackdowns that sometimes undermined the systems entirely. The economics are challenging.
Most bike-sharing systems require ongoing public subsidy, and the systems that work best tend to be those integrated into broader public transit networks rather than operated as standalone services. A bike-sharing system dropped into a city without protected lanes, secure parking, or transit connections will underperform regardless of how many bikes are deployed. Cities considering bike-sharing should be cautious about vendor promises and should treat shared bikes as one component of a cycling ecosystem, not as a substitute for infrastructure investment. Ireland’s approach — committing €677 million to the National Cycle Network to create 3,500 km of safe cycling corridors by 2030 — reflects an understanding that the network matters more than the bikes themselves.
E-Bikes as a Game Changer for Urban Cycling
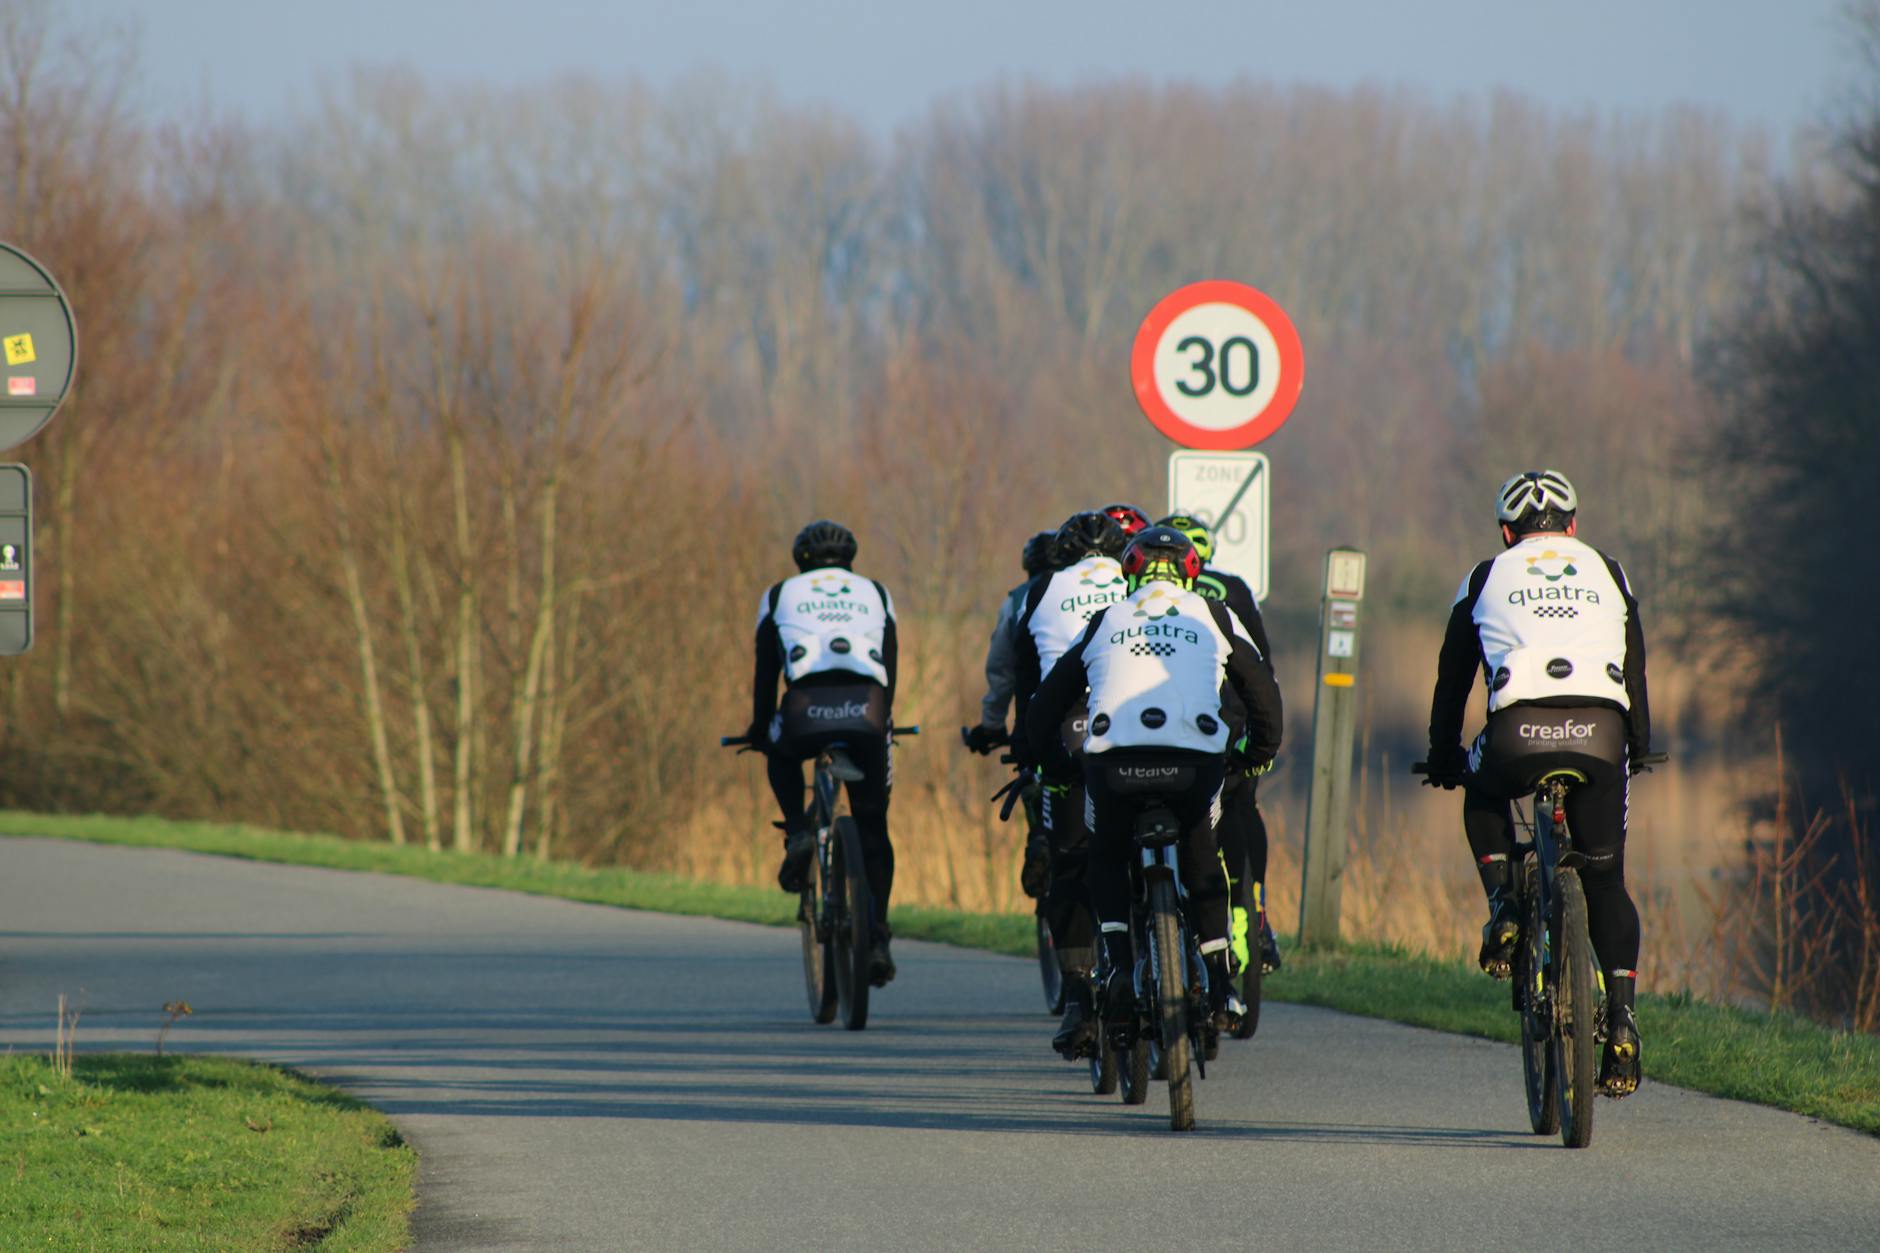
The rapid integration of e-bikes into urban cycling is arguably the most significant development in bicycle transportation since the protected bike lane. With 7.4 million electric bikes among the global shared fleet and private ownership growing rapidly, e-bikes eliminate many of the traditional objections to cycling: hills, distance, sweat, and fitness requirements.
The 300% surge in e-bike usage in cities like San Francisco and Seattle, with average trips stretching from 2.5 to 8 miles, demonstrates that e-bikes do not just replace existing bike trips — they replace car trips. Cities that design infrastructure only for traditional cycling speeds and distances risk building networks that are already outdated.
Where Cycling Promotion Is Headed
The trajectory is clear: cities that invest seriously in cycling infrastructure see measurable, sometimes dramatic results, and the tools available — protected lanes, e-bike integration, bike-sharing, traffic calming, and legal mandates — are well understood. The global bike-sharing market’s projected growth from $7.83 billion in 2025 to $11.85 billion by 2030 reflects institutional confidence in this direction.
Copenhagen’s integration of cycling with carbon-neutrality goals points to where policy is heading: cycling is increasingly framed not as a transportation alternative but as essential climate infrastructure. The cities that recognize this earliest will build the most resilient, livable urban environments — and the data suggests that the return on investment, at $11 for every $1 spent, makes the economic case almost impossible to argue against.
Conclusion
The evidence from cities worldwide is consistent: promoting bicycle transportation requires protected infrastructure as the foundation, sustained per-capita investment in the range of $20 to $50 annually, integration with public transit and bike-sharing systems, and political willingness to reallocate road space from cars. Paris proved that transformation is possible even in car-dominated cities. Utrecht and Copenhagen demonstrate what mature cycling cultures look like. And U.S.
cities like Brooklyn, Cambridge, and Saint Paul show that rapid improvement is achievable when investment and policy align. The practical takeaway for any city is that half-measures — painted lanes, occasional bike racks, small pilot programs — do not produce meaningful mode shift. The cities seeing real results are the ones spending real money on physical protection, integrating e-bikes into their planning, and treating cycling as infrastructure rather than recreation. With every dollar invested returning eleven in benefits, the question is no longer whether cities can afford to promote cycling but whether they can afford not to.
Frequently Asked Questions
How much do cities typically spend per resident on cycling infrastructure?
Top-rated cycling cities invest between $20 and $50 per resident annually on cycling infrastructure, with Utrecht at the high end spending €63 per resident per year. This sustained investment is a key differentiator between cities that see real mode shift and those that do not.
Do bike-sharing systems actually increase cycling in cities?
Bike-sharing systems can increase cycling, but they work best as part of a broader ecosystem that includes protected lanes, transit integration, and secure parking. As of late 2024, 9.28 million shared bikes operate across 2,145 systems in 92 countries, but many standalone systems struggle with financial sustainability without supporting infrastructure.
Are e-bikes making a significant difference in urban cycling?
Yes. E-bike usage has surged 300% in cities like San Francisco and Seattle, and average trip lengths have increased from 2.5 to 8 miles. Approximately 40% of the global shared bike fleet is now electric, and e-bikes are converting car trips into cycling trips by eliminating barriers like hills, distance, and physical effort.
What is the return on investment for cycling infrastructure?
Studies show that every $1 invested in cycling infrastructure generates $11 in benefits, including reduced healthcare costs, lower traffic congestion, decreased air pollution, and increased economic activity along cycling corridors.
Which city has the best cycling infrastructure in the world?
Utrecht in the Netherlands tops the 2025 Copenhagenize Index, with nearly one-third of all trips made by bicycle. Copenhagen has the highest infrastructure density at 52 km of protected cycle paths per 100 km of roadway. Amsterdam sees 37% of all trips by bicycle. The answer depends on which metric you prioritize.


